Understanding LEA Charts: A Deep Dive into Football Analytics
Lea Charts have become increasingly popular in the world of football analytics, offering a unique perspective on team and player performance. While traditional statistics like goals and assists provide a surface-level view, LEA charts delve deeper, revealing the underlying processes that contribute to success on the pitch.
What are LEA Charts and Why Do They Matter?
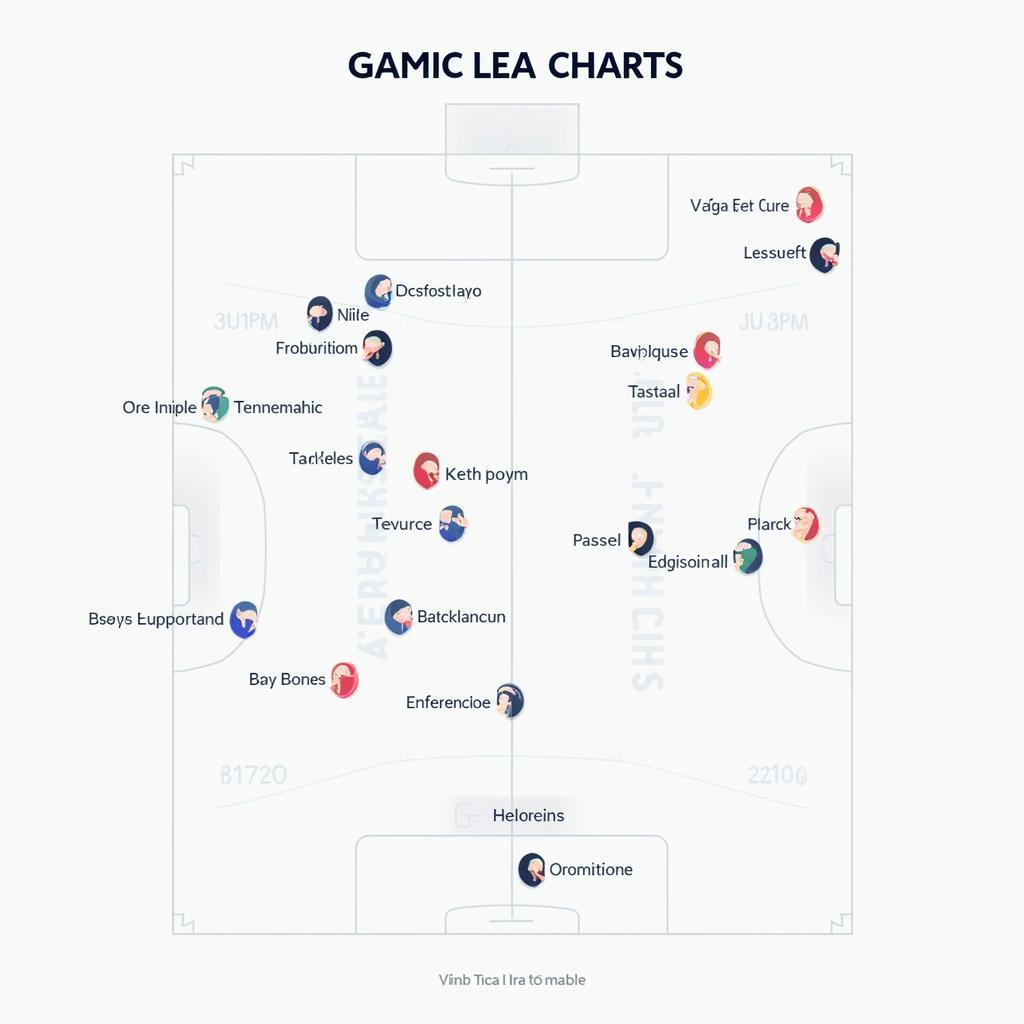
LEA stands for Location, Event, and Action. This type of chart visually represents all the events in a football match, categorizing them based on location, type of action, and the event’s outcome. Imagine a timeline of the game, meticulously broken down into individual actions, each assigned a specific coordinate on the chart. This visualization allows analysts, coaches, and fans to grasp the tactical nuances and strategic decisions that might otherwise go unnoticed.
 Example of an LEA Chart
How LEA Charts Work: Breaking Down the Components
To fully understand the power of LEA charts, let’s break down their key components:
- Location: The chart represents the football pitch, divided into zones. Each action is plotted according to where it occurred on the field.
- Event: This refers to the type of action that took place, such as a pass, shot, tackle, interception, or dribble.
- Action: This element describes the outcome of the event. For instance, a pass can be successful (complete), unsuccessful (incomplete), or intercepted.
By combining these three elements, LEA charts paint a vivid picture of how a team builds attacks, defends, and transitions between phases of play.
Unlocking Tactical Insights with LEA Charts
One of the most valuable aspects of LEA charts lies in their ability to provide actionable insights into a team’s tactical approach. For instance:
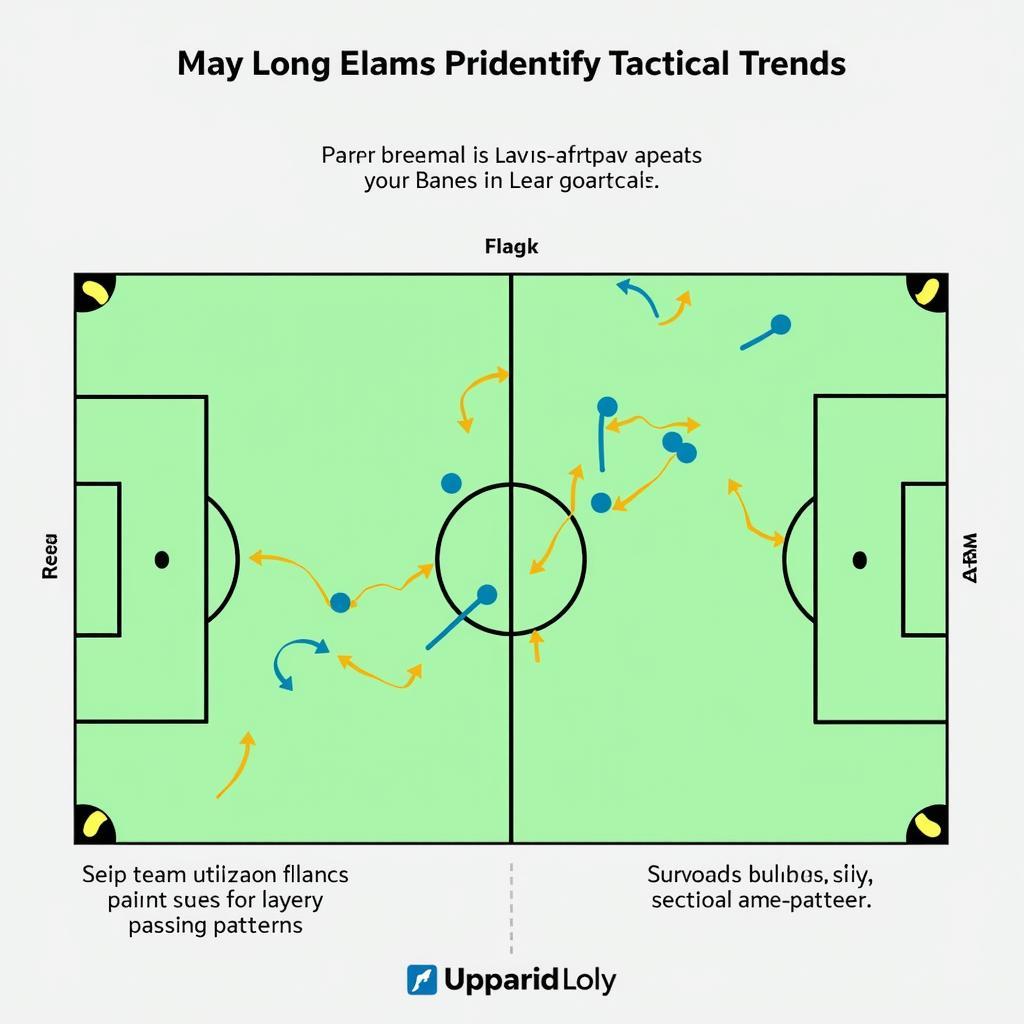
- Passing Networks: LEA charts can reveal patterns in a team’s passing. By connecting successful passes, analysts can visualize passing networks, identifying key playmakers and understanding how a team progresses the ball up the field.
- Defensive Structure: Analyzing defensive actions on an LEA chart can highlight a team’s defensive strengths and weaknesses. It can show areas where the opposition is finding success and whether a team favors a high press or a deeper defensive block.
- Transitional Play: LEA charts can track how effectively a team transitions from defense to attack and vice versa. This can be crucial in analyzing counter-attacking opportunities or identifying vulnerabilities in a team’s defensive shape immediately after losing possession.
 Analyzing Tactical Trends with LEA Charts
LEA Charts: The Future of Football Analysis?
While still a relatively new tool in the world of football analytics, LEA charts hold immense potential. Their ability to transform raw data into digestible visualizations makes them incredibly valuable for coaches, scouts, and analysts.
- Player Recruitment: LEA charts can be used to scout potential transfer targets. By analyzing a player’s actions within their team’s system, clubs can assess if a player’s style aligns with their tactical philosophy.
- Performance Evaluation: Beyond basic statistics, LEA charts offer a nuanced perspective on individual player performance. This can help coaches provide targeted feedback, identify areas for improvement, and make more informed decisions about player selection and tactics.
- Fan Engagement: As LEA charts become more accessible, they offer fans a deeper understanding of the beautiful game. Visualizing the complexities of football can enhance match analysis, foster greater appreciation for tactical nuances, and fuel discussion amongst supporters.
LEA Charts and Beşiktaş: A Winning Combination?
While we can’t reveal specific tactical insights, it’s not hard to imagine how Beşiktaş, a club renowned for its passionate fanbase and commitment to attacking football, could benefit from the power of LEA charts. By harnessing the insights derived from these visualizations, Beşiktaş can continue to refine its tactical approach, optimize player performance, and maintain its position as a dominant force in Turkish and European football.
Conclusion
LEA charts are transforming the way we understand and analyze football. By providing a visual representation of every action on the pitch, they unlock a treasure trove of tactical insights. As the use of data analytics becomes increasingly sophisticated, expect LEA charts to play a pivotal role in shaping the future of the beautiful game, from player development and recruitment to tactical innovation and fan engagement.
FAQ
1. Are LEA charts only useful for professional teams?
No, LEA charts can be valuable for teams at all levels, from amateur to professional. They provide insights that can help coaches and analysts understand the game better and make more informed decisions.
2. Where can I find LEA charts for Beşiktaş matches?
While publicly available LEA charts for specific matches might be limited, various resources offer insights into football analytics, and some might provide LEA chart examples or analyses.
3. Can I create my own LEA charts?
Yes, with the right tools and software, you can create your own LEA charts. However, it requires a deep understanding of football data and analytical techniques.
4. Are there other types of football data visualizations besides LEA charts?
Yes, the world of football analytics is constantly evolving, and many other data visualization techniques exist, such as heatmaps, passing networks, and expected goals (xG) models.
5. How will LEA charts evolve in the future?
As technology advances, expect LEA charts to become more sophisticated and integrated with other data sources. We might see them incorporated into real-time match analysis, virtual reality training simulations, and even fan engagement platforms.
If you are interested in learning more about the fascinating world of football analytics or other aspects of Beşiktaş, be sure to check out these related articles:
For any further inquiries or support, please do not hesitate to contact our dedicated team:
Phone Number: 0989060241
Email: [email protected]
Address: Tở 2, ấp 5, An Khương, Hớn Quản, Bình Phước, Vietnam.
Our customer service representatives are available 24/7 to assist you.

